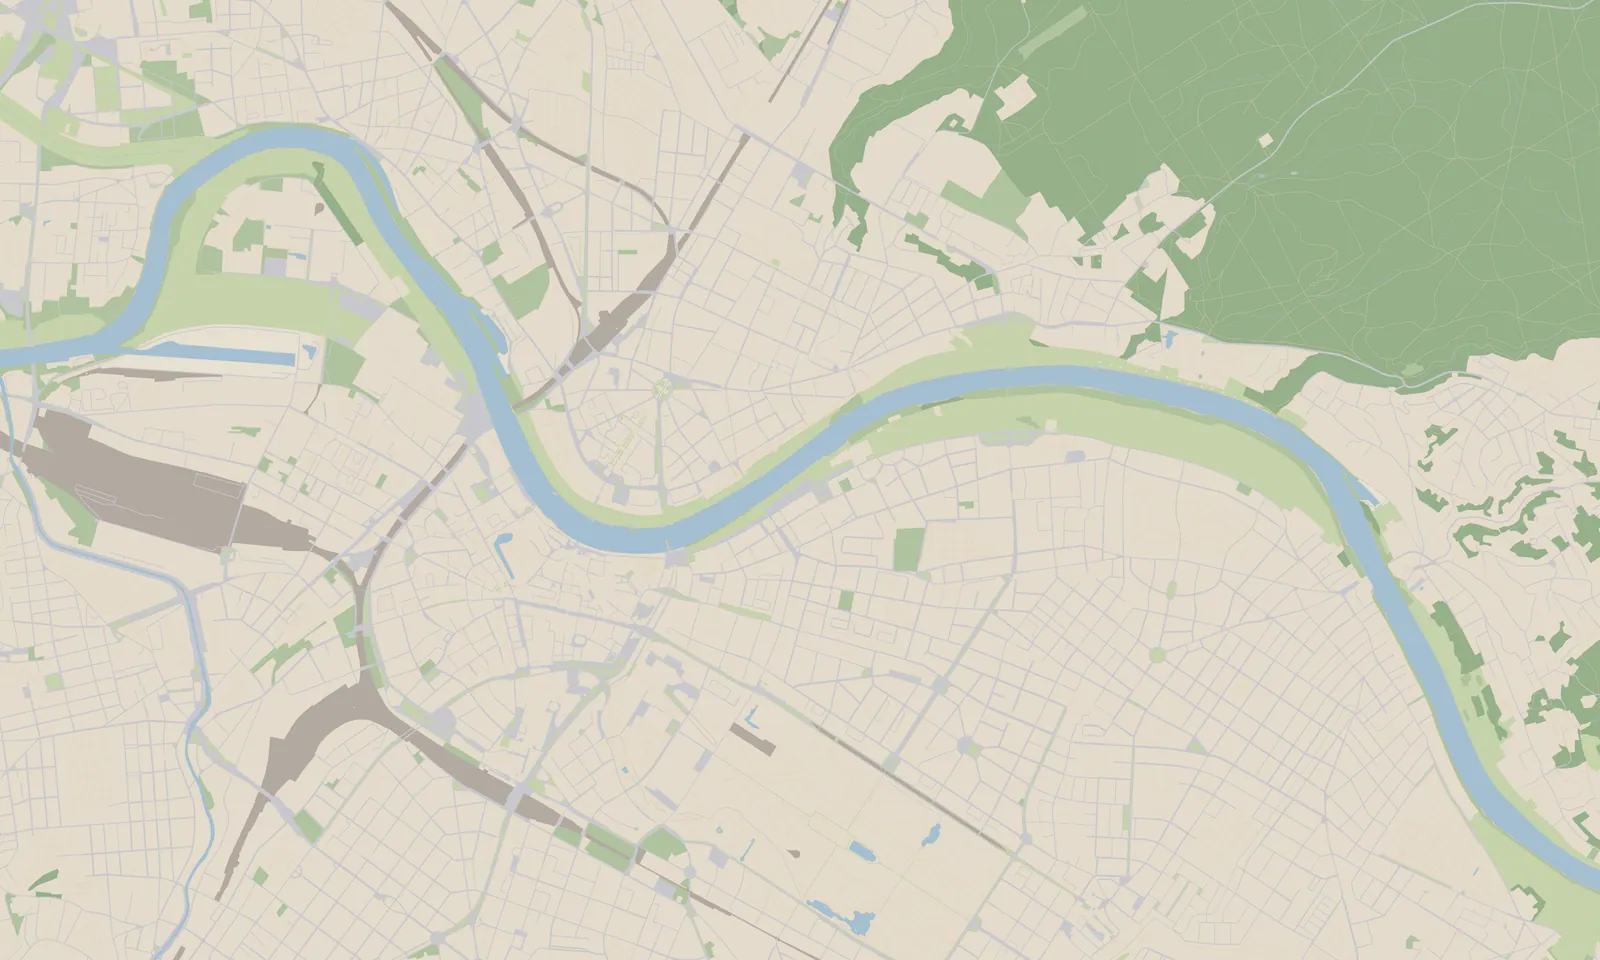
Sources by city
Deutsch: Quellen nach Stadt
Every city is drawn the same way, but not every Land publishes the same data openly. This table shows, for each city and each thing the viewer draws, where it comes from — and whether that is the best source there is, the only one, or a stand-in for a better one the Land or city does not publish. The datasets themselves (downloads, strengths, licences) are described in Where the data comes from.
| What is drawn | Dresden | Grimma | Hamburg | Leipzig | Meißen | München | Unna | Berlin (configured, not built yet) |
|---|---|---|---|---|---|---|---|---|
| Land | Sachsen | Sachsen | Hamburg | Sachsen | Sachsen | Bayern | Nordrhein-Westfalen | Berlin |
| Surfaces (roads, water, meadow …) | 🟢 OSM + Basis-DLM | 🟢 OSM + Basis-DLM | 🟢 OSM | 🟢 OSM + Basis-DLM | 🟢 OSM + Basis-DLM | 🟢 OSM + Basis-DLM | 🟢 OSM + Basis-DLM | 🟢 OSM |
| Railway tracks | 🟢 Basis-DLM | 🟢 Basis-DLM | 🟡 OSM ¹ | 🟢 Basis-DLM | 🟢 Basis-DLM | 🟢 Basis-DLM | 🟢 Basis-DLM | 🟡 OSM ¹ |
| Bridge decks | 🟢 Basis-DLM + DOM1 | 🟢 Basis-DLM + DOM1 | 🟡 OSM + DOM1 ¹ | 🟢 Basis-DLM + DOM1 | 🟢 Basis-DLM + DOM1 | 🟢 Basis-DLM + DOM1 | 🟢 Basis-DLM + DOM1 | 🟡 OSM + DOM1 ¹ |
| Street trees (species, crown) | 🟢 tree register | 🟡 OSM + DOM1 ² | 🟡 tree register ³ | 🟢 tree register | 🟡 OSM + DOM1 ² | 🟡 OSM + DOM1 ² | 🟡 OSM + DOM1 ² | 🟢 tree register |
| Tree rows, hedges | 🟢 Basis-DLM + OSM | 🟢 Basis-DLM + OSM | 🟡 OSM ¹ | 🟢 Basis-DLM + OSM | 🟢 Basis-DLM + OSM | 🟢 Basis-DLM + OSM | 🟢 Basis-DLM + OSM | 🟡 OSM ¹ |
| Trees in gardens and courtyards | 🟢 laser scan | 🟢 laser scan | 🟡 DOP + DOM1 ⁴ | 🟢 laser scan | 🟢 laser scan | 🟢 laser scan | 🟢 laser scan | 🟡 DOP + DOM1 ⁵ |
| Sheds, hedge heights | 🟢 laser scan | 🟢 laser scan | 🟡 DOM1 (hedge heights) ⁴ | 🟢 laser scan | 🟢 laser scan | 🟢 laser scan | 🟢 laser scan | 🟡 DOM1 (hedge heights) ⁵ |
| Vegetation colour (vigour) | 🟢 DOP (NDVI) | 🟢 DOP (NDVI) | 🟢 DOP (NDVI) | 🟢 DOP (NDVI) | 🟢 DOP (NDVI) | 🟡 DOP RGB (GLI) ⁶ | 🟢 DOP (NDVI) | 🟢 DOP (NDVI) |
| Shop windows, facade readings | 🟢 Mapillary | 🟢 Mapillary | 🟢 Mapillary | 🟢 Mapillary | 🟢 Mapillary | 🟢 Mapillary | ⚪ — ⁷ | ⚪ — ⁸ |
| Monuments, fountains | 🟢 Basis-DLM + OSM | 🟢 Basis-DLM + OSM | 🟡 OSM ¹ | 🟢 Basis-DLM + OSM | 🟢 Basis-DLM + OSM | 🟢 Basis-DLM + OSM | 🟢 Basis-DLM + OSM | 🟡 OSM ¹ |
| Street furniture, lamps, stairs, walls, fences, markings, paving, sports grounds, trams, landing stages | 🔵 OSM + Mapillary | 🔵 OSM + Mapillary | 🔵 OSM | 🔵 OSM | 🔵 OSM + Mapillary | 🔵 OSM | 🔵 OSM + Mapillary | 🔵 OSM |
| Data layer: motor traffic | 🟢 city counts | 🟡 road census ⁹ | 🟢 city counts (main roads) | ⚪ — ¹⁰ | 🟡 road census ⁹ | ⚪ — ¹⁰ | 🟡 road census ⁹ | 🟢 city counts |
| Data layer: cycling, live | 🟢 city counters | ⚪ — ¹¹ | 🟢 city counters | ⚪ — ¹¹ | ⚪ — ¹¹ | ⚪ — ¹¹ | ⚪ — ¹¹ | ⚪ — ¹¹ |
| Data layer: trams by timetable | 🟢 GTFS (DELFI) + OSM | ⚪ — ¹² | ⚪ — ¹² | 🟢 GTFS (DELFI) + OSM | ⚪ — ¹² | 🟢 GTFS (DELFI) + OSM | ⚪ — ¹² | 🟢 GTFS (DELFI) + OSM |
| 🟢 from the best source | 21 / 23 | 17 / 23 | 13 / 23 | 19 / 23 | 17 / 23 | 17 / 23 | 16 / 23 | 13 / 23 |
Legend
- 🟢 official or measured — the best source there is
- 🔵 OpenStreetMap — the only source for it (community-mapped, as complete as the city's mappers made it)
- 🟡 a substitute — the better source is missing for this city (the footnote says why)
- ⚪ not drawn — no open source (the footnote says why)
Why not the best source
- The Land publishes no open Basis-DLM (the official landscape model), so OpenStreetMap stands in.
- The city publishes no open street-tree register; its trees come from the canopy, the laser scan and the trees mapped in OSM (species from OSM, height from the surface model).
- The register has no tree heights: each tree's height comes from its genus and trunk diameter (fitted on Dresden's and Leipzig's registers); the surface model only raises a height it clearly exceeds and drops a tree it shows gone.
- The Land publishes no open classified laser scan (Hamburg declined to, citing privacy).
- The pipeline does not read this Land's laser scan yet (no adapter for it).
- The open aerial photograph has no infrared band: the vegetation index is computed from its visible colours (the Green Leaf Index), which tells green from grey well but vigour less well.
- Mapillary has no street panoramas here, only flat photos, which the measurement cannot place on a wall.
- The pipeline has not measured this city's street photos (Mapillary) yet.
- The city publishes no counts of its own: the road census counts the federal, state and district roads only, both directions together (shown split evenly).
- No open counts per road section: the city publishes none, and the road census does not reach its centre.
- No open bicycle counter the browser can read live (counts published yearly, monthly or daily only, or none).
- The city has no trams.
The same in every city
These come from the same kind of source everywhere — every Land publishes them openly, or OpenStreetMap is the one source for them:
- Terrain: 🟢 DGM1
- Buildings: 🟢 LoD2
- Bridge arches, trusses, pylons: 🟢 DOM1 + OSM/Wikidata
- Tree canopy: 🟢 DOM1 − DGM1
- Roof colours: 🟢 DOP
- Facade materials: 🔵 OSM + neighbourhood
- Towers, chimneys, missing buildings: 🟢 DOM1 + OSM
- Landmarks: 🟢 Wikidata + OSM
- Sky light, far shadows: 🟢 DGM1 + LoD2 + Copernicus GLO-30
This page is generated from the site and provider configurations
(bun run docs:matrix, lib/city/source-matrix.ts), so it always says
what the pipeline actually reads.